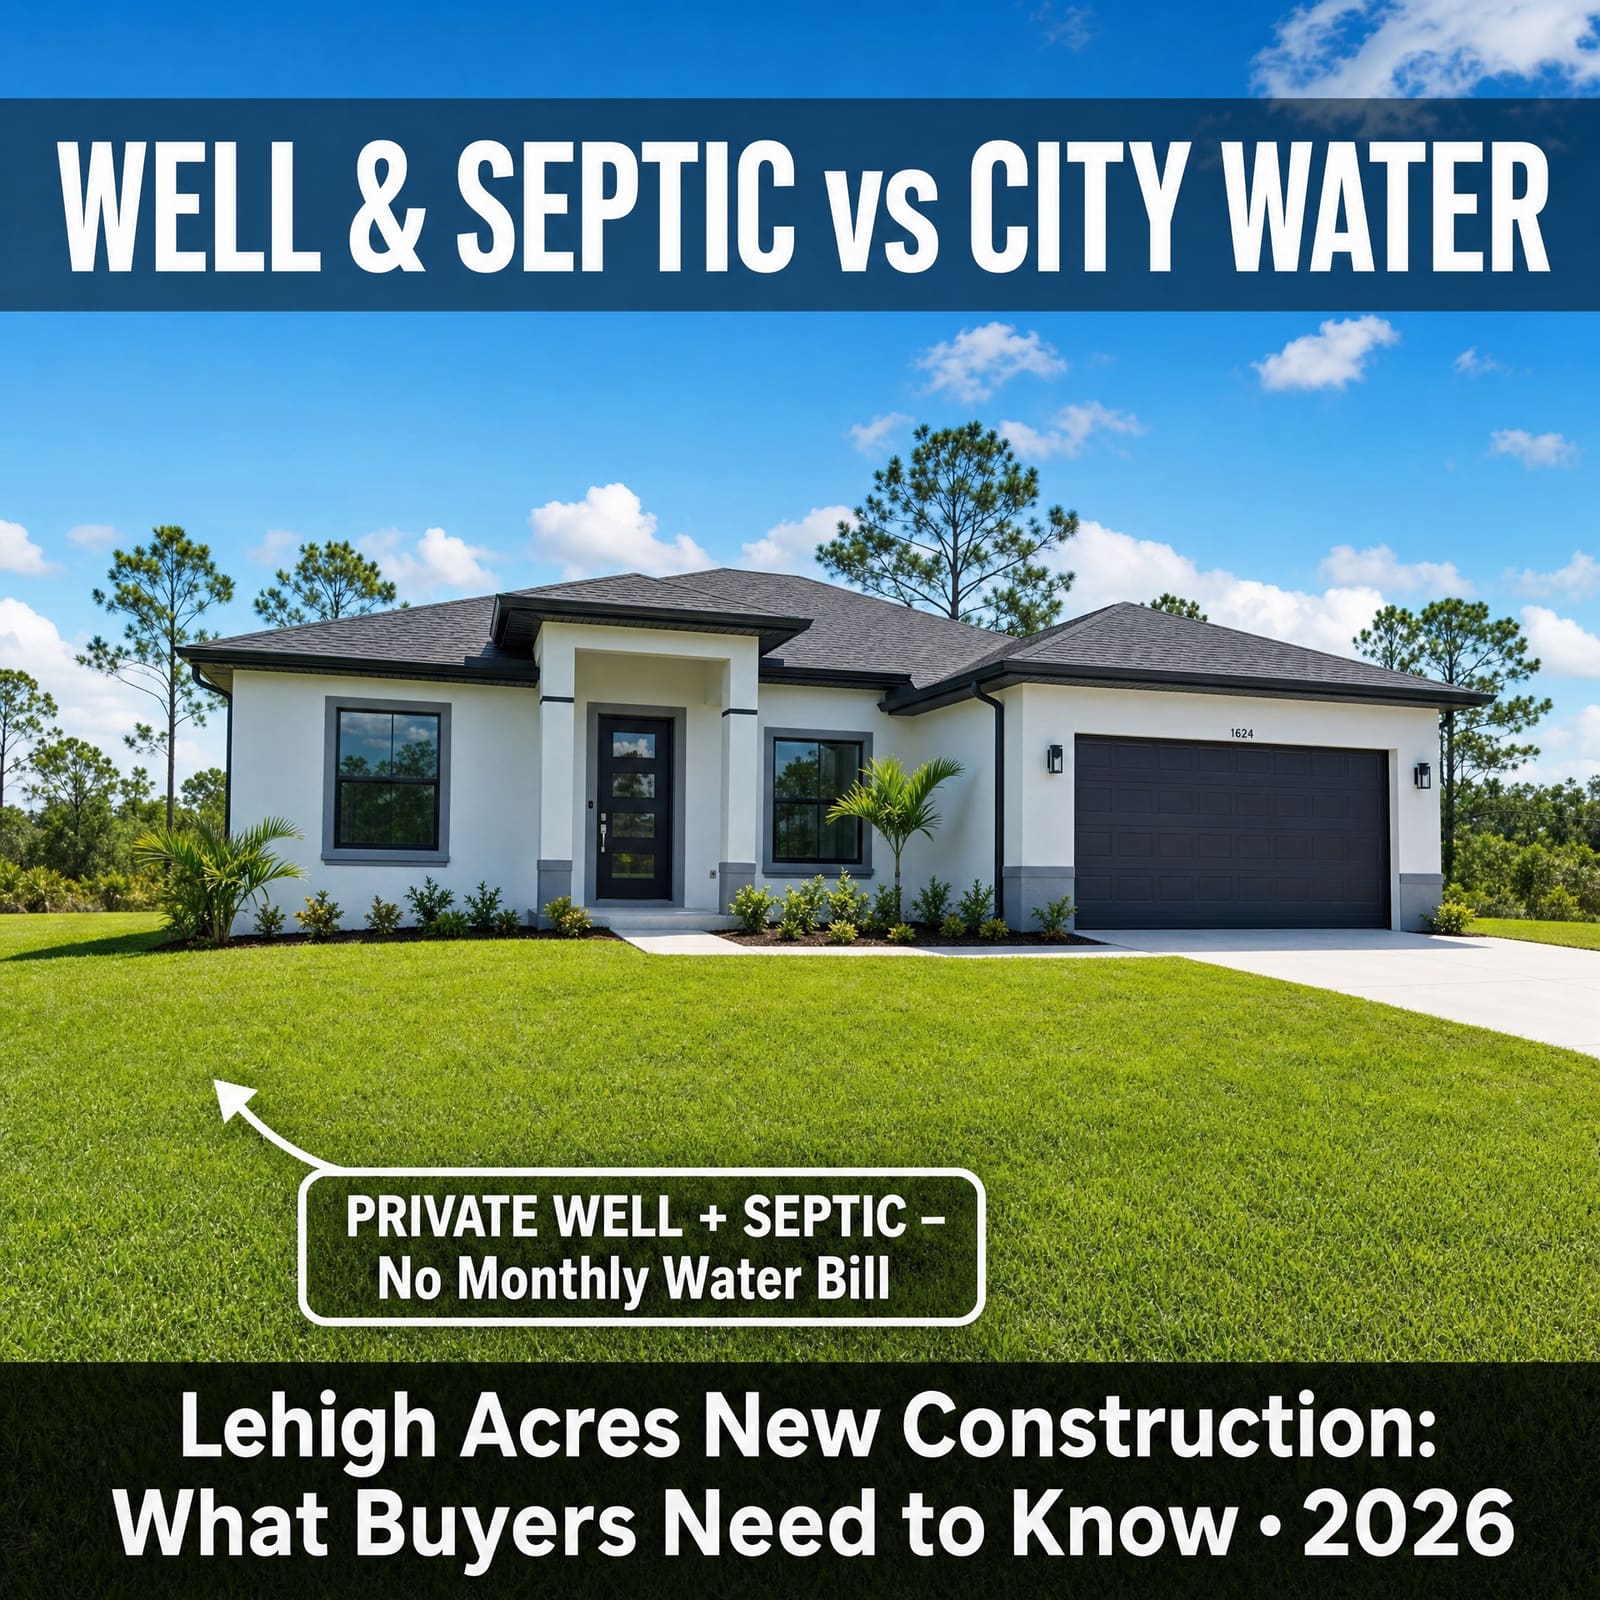
Lehigh Acres New Construction Market Report: July 2026
1,062 new-construction homes on the board — nearly double Cape Coral — median $340,000, full-ask closings. What actually moved in July 2026.
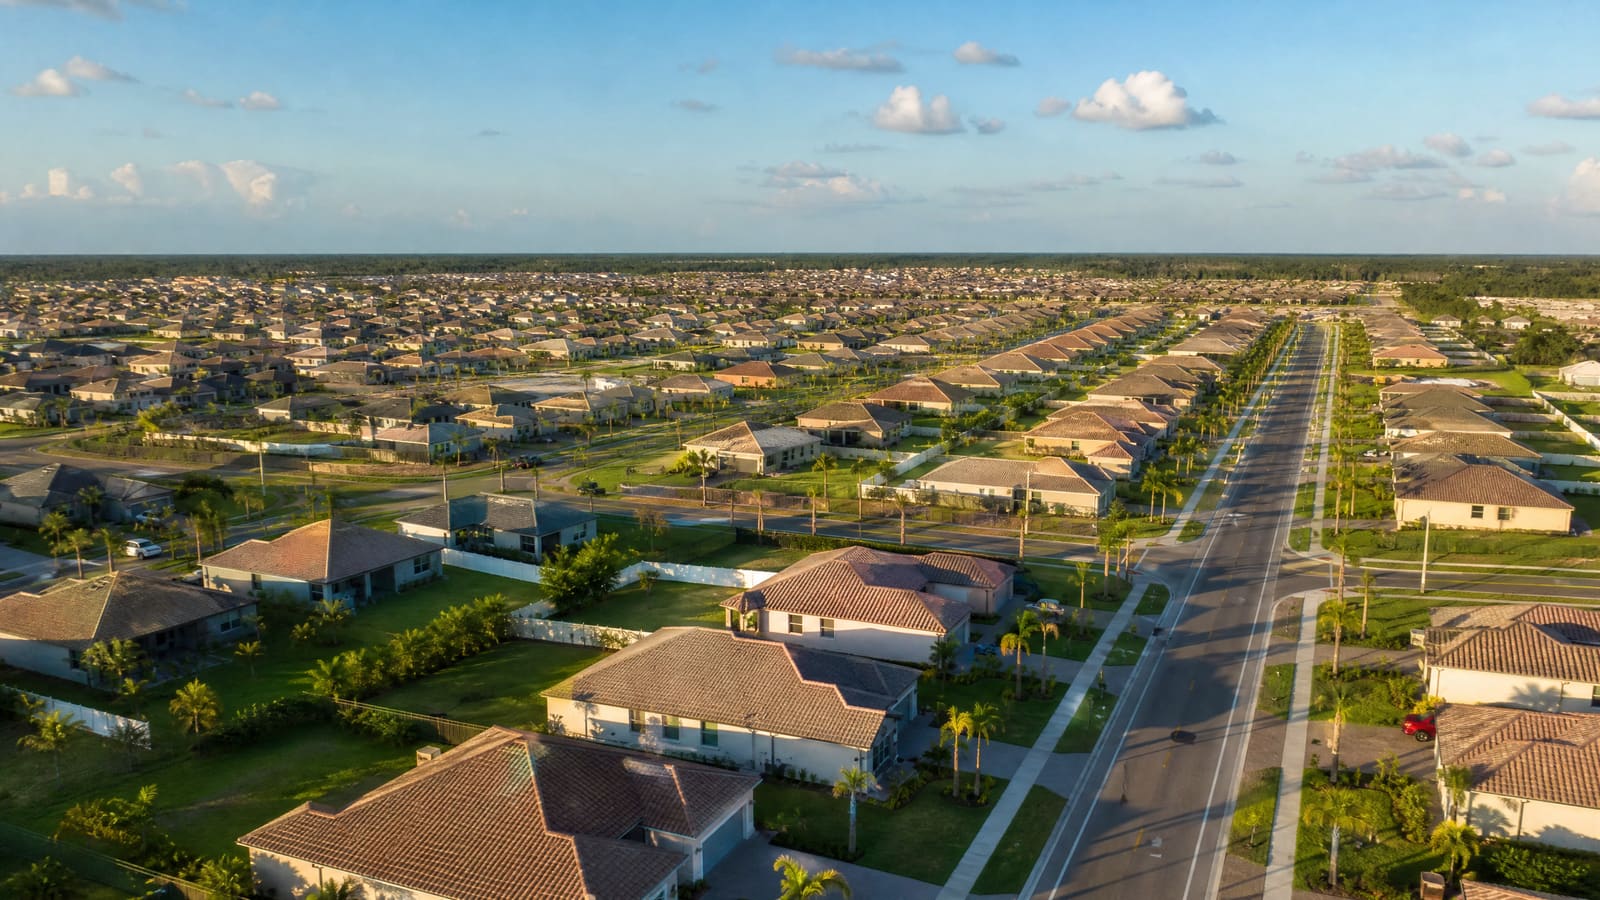
Pull up the live board today and you'll count 1,062 new-construction homes for sale in Lehigh Acres. Over a thousand. Nearly double what's sitting across the county line in Cape Coral, and that's not a fluke of one good month — it's the defining fact of this market. Lehigh doesn't compete on scarcity. It competes on volume, and this month proves it.
So is that good news or bad news for you? Depends entirely on who you ask. A builder eyeing 1,062 competitors calls that a crowded field. A buyer with a real budget and a real timeline calls it the best selection in Lee County. I'm going to give you the real numbers and let you decide which side of that you're on — because in Lehigh, both are true at once.
The Lehigh Acres Numbers This Month
Here's the board as it actually reads today, straight off the live MLS feed:
| Metric | July 2026 |
|---|---|
| Active new-construction listings | 1,062 |
| Price range | $187,498 – $1,190,000 |
| Median list price | $340,000 |
| Avg. days on market (active) | 125 days |
| New listings, last 30 days | 227 |
| Closings, last 120 days | 867 |
| Median sale-to-list ratio | 100.0% |
| Median days on market (closed) | 100 days |
| Months of supply | 4.9 |
Look at that gap between active and closed: 125 days average on the board, 100 days median on the homes that actually sold. Homes that move in Lehigh move fast relative to the board average — the average gets pulled up by the listings that are sitting, and that's true here just like it is in the Cape.
And look at that sale-to-list ratio: 100.0%. Full ask, on the median closed home. Compare that to Cape Coral's 99.0% this same month. Lehigh's lower price point isn't translating into softer negotiating on the homes that actually change hands — buyers here are paying what's asked, because at this price point, demand keeps showing up. 4.9 months of supply, 227 fresh listings in the last 30 days alone, and homes are still closing at full price. That's a market that's deep, not desperate.
Where the New Inventory Is Actually Landing
Not all 1,062 of those homes are spread evenly. Three zip codes carry the bulk of it:
- 33974 — 350 active listings. Nearly a third of the entire community's new-construction inventory sits in this one zip.
- 33971 — 209 active listings.
- 33972 — 189 active listings.
Those top three zips alone account for 748 of the 1,062 homes on the board — 70% of everything for sale. If you're browsing Lehigh broadly, start there. That's where the volume actually is.
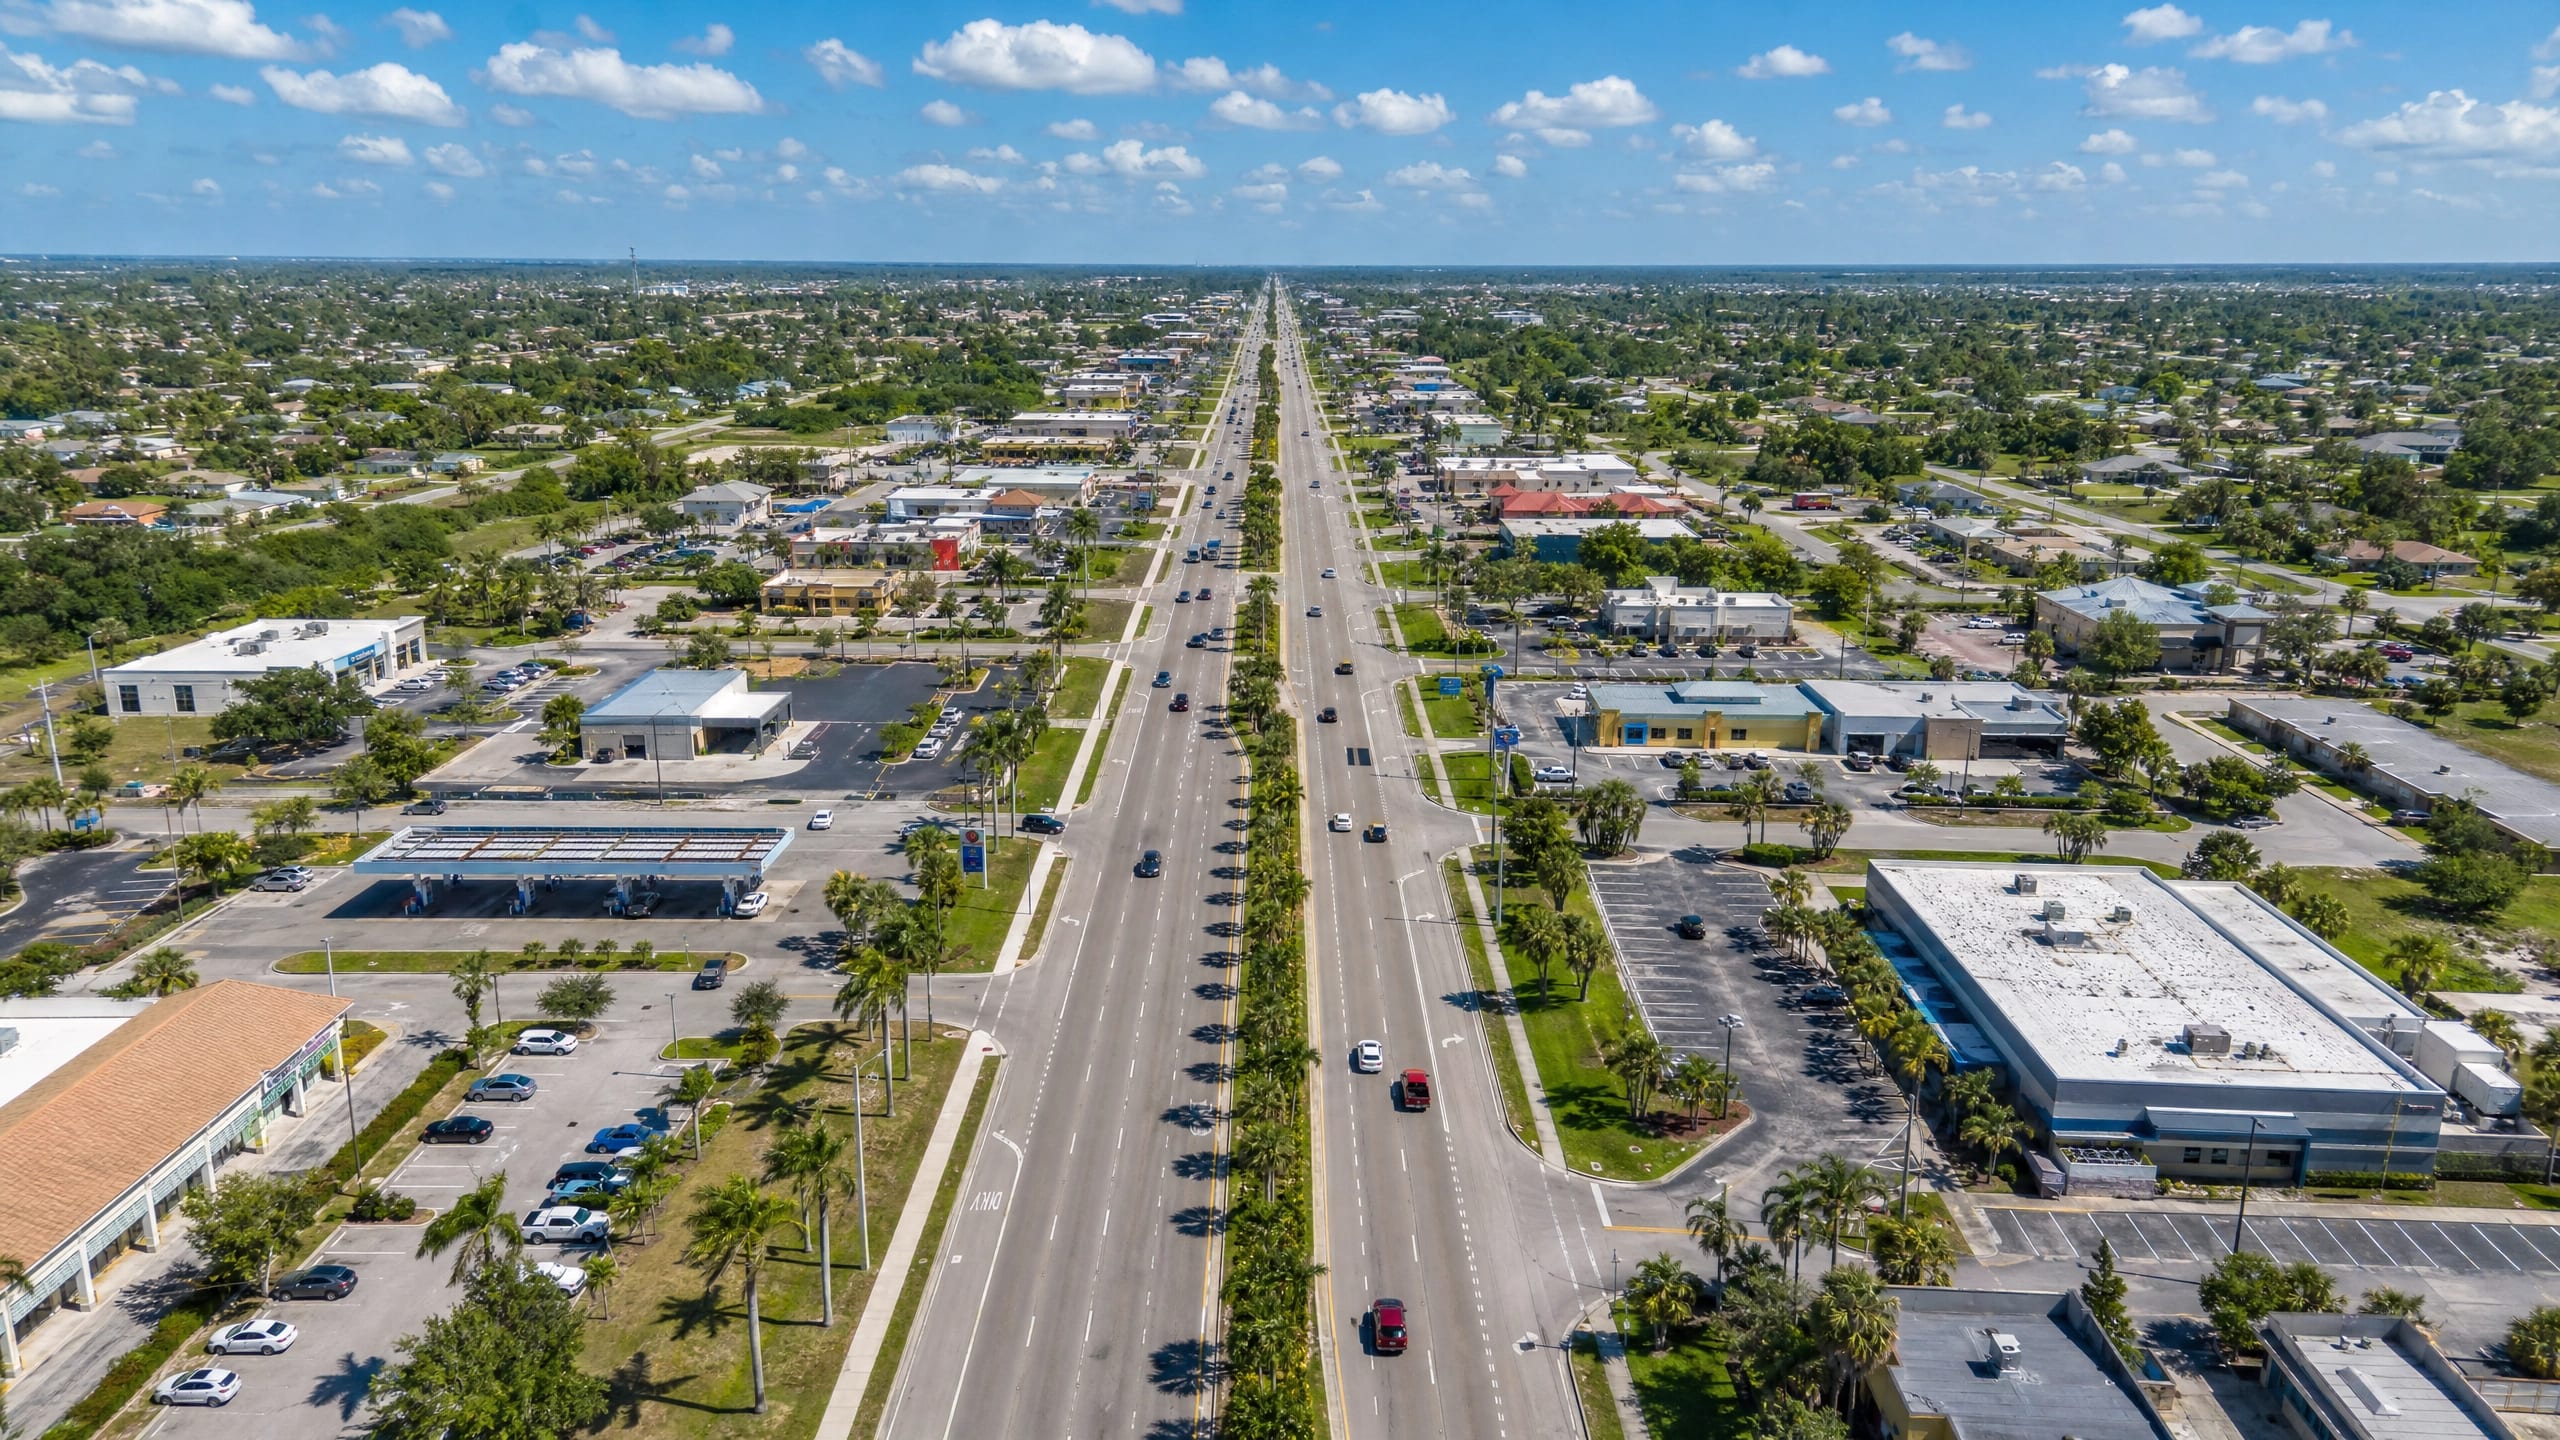
We don't track a listing-level flood-zone breakdown in this site's database the way we do in Cape Coral, but we've covered the real Lehigh flood story in depth elsewhere on this site: most of the community sits in minimal-risk Zone X, and the exceptions concentrate along the canal and slough edges, not across the interior lots carrying this month's inventory.
What the Wider Region Is Telling Us
Zoom out one level. The Cape Coral–Fort Myers metro area as a whole — every home type, new and resale, Lehigh included — logged 10,575 active listings in June against 11,347 in May, with the metro median easing from $399,000 to $396,850 and days on market ticking up from 87 to 90.
Read that carefully: fewer listings, a slightly softer median, slightly slower sales. That's a metro cooling a notch, not collapsing — and it's resale-and-everything-else data, not a new-construction-specific number, so don't hang your whole decision on it. But it tells you the direction the wind is blowing across Southwest Florida broadly. What's notable is that Lehigh's own new-construction numbers — full ask on closings, 227 fresh listings added in a single month — don't look like a market following that metro-wide cooling. This is the affordable end of the market, and affordable is exactly where demand tends to hold up longest.
Listen Up: What 125 Days on the Board Actually Means for You
Here's the skinny, and it's the one paragraph in this whole report worth remembering.
A home sitting 125 days in Lehigh isn't automatically a red flag — with over a thousand homes competing for buyers, some sitting time is just math. But it does mean some builders here have real inventory pressure, and others don't have any at all. The gap between 125 days average and 100 days median-on-close tells you the same story it tells in Cape Coral: some homes here are moving fast on their own merits, and some are waiting for the right buyer to walk in and ask. Don't assume every listing in Lehigh needs a deal to move — full-price closings at 100.0% sale-to-list tell you plenty of these homes don't. We break down exactly which builders are cutting prices and which ones aren't in this month's builder incentive report.
💡 Key Takeaways
- 1,062 active new-construction listings in Lehigh Acres this month — nearly double Cape Coral's — median $340,000, up 227 new listings in the last 30 days.
- The active-board average of 125 days on market is pulled up by slower listings — homes that actually closed sold in a median of 100 days.
- Closed sales landed at a full 100.0% of list price, a stronger ratio than Cape Coral's 99.0% this same month, despite Lehigh's much lower price point.
- Nearly a third of all active inventory (350 of 1,062 homes) sits in a single zip code — 33974.
- The broader Cape Coral–Fort Myers metro cooled slightly month over month (all home types) — Lehigh's own new-construction numbers don't show that same softening yet.
Frequently Asked Questions
How many new construction homes are for sale in Lehigh Acres right now?
As of July 2026, there are 1,062 active new-construction listings in Lehigh Acres, priced from $187,498 to $1,190,000, with a median list price of $340,000.
Is Lehigh Acres a buyer's market or a seller's market for new construction?
At 4.9 months of supply, Lehigh still technically favors builders — six months is the standard buyer's-market tipping point — but with 1,062 active listings and 227 new ones added in just the last 30 days, buyers have a wide selection and real room to compare.
What's the average time on market for new construction in Lehigh Acres?
The active board averages 125 days, but homes that actually closed in the last 120 days had a median of just 100 days on market — a faster real-world pace than the board average suggests.
Which zip codes have the most new construction in Lehigh Acres?
33974 leads with 350 active listings, followed by 33971 with 209 and 33972 with 189. Those three zips hold 70% of the community's entire new-construction inventory.
Are homes selling at asking price in Lehigh Acres?
Yes — closed sales in the last 120 days landed at a median 100.0% of list price, meaning half of all closings sold at or above the final asking price. That's a strong ratio for a market with this much active inventory.
See What's Actually Available
The board changes every week. See it live, filtered by what matters to you:
- Every active new build in Lehigh Acres
- Zip 33974 — the largest concentration of new construction in the community
- New construction under $400K
- Live market data dashboard
Not sure whether this month's inventory means you should move now or wait? That's the whole reason we're here.
If you need a straight read on the Lehigh Acres market before you make an offer, call us at (239) 366-3996 and we'll tell you which listings actually have room to negotiate — and which ones don't.